Analytics made easy with Google Data Studio.
Web analytics are Marmite to digital marketers, they either love them or hate them. However, every marketing professional knows that it’s essential to keep on top of analytics and it isn’t as difficult as you might think. Ridgeway explains how you can turn a necessary evil into your best digital buddy.

Easy analytics might sound like an oxymoron, but by implementing some often-overlooked features in Google Analytics, and setting-up a customised Google Data Studio dashboard, analytics can be surprisingly simple.
Why are web analytics important?
Web analytics allow you to make data-driven decisions, without the need for guesswork, and can help:
- Measure performance
- Identify issues
- Identify opportunities
- Validate decisions
There’s no doubting the power of analytics and some might say they are too powerful with seemingly limitless data leading to cases of analysis paralysis. However, it’s perfectly possible to make big data manageable provided you have clearly defined goals and get to grips with Google Analytics.
Underrated Google Analytics Features
It’s easy to see why Google Analytics is the web’s favorite analytics package (it’s user-friendly, provides reliable data and best of all it’s free) plus it’s packed with features to help make analysis easier. Two often overlooked features, which are well-worth revisiting, are Annotations and Alerts.
Google Analytics Annotations
Google Analytics Annotations are a useful way to keep track of events that may impact performance and are essential when multiple users are working on a single account. If used regularly they can provide invaluable context to help unpick performance changes by recording events on your analytics timeline such as:
- Online and offline campaigns (from PPC to offline advertising)
- Changes to the website (from deployments to server updates)
- SEO factors (from backlink builds to algorithm updates)

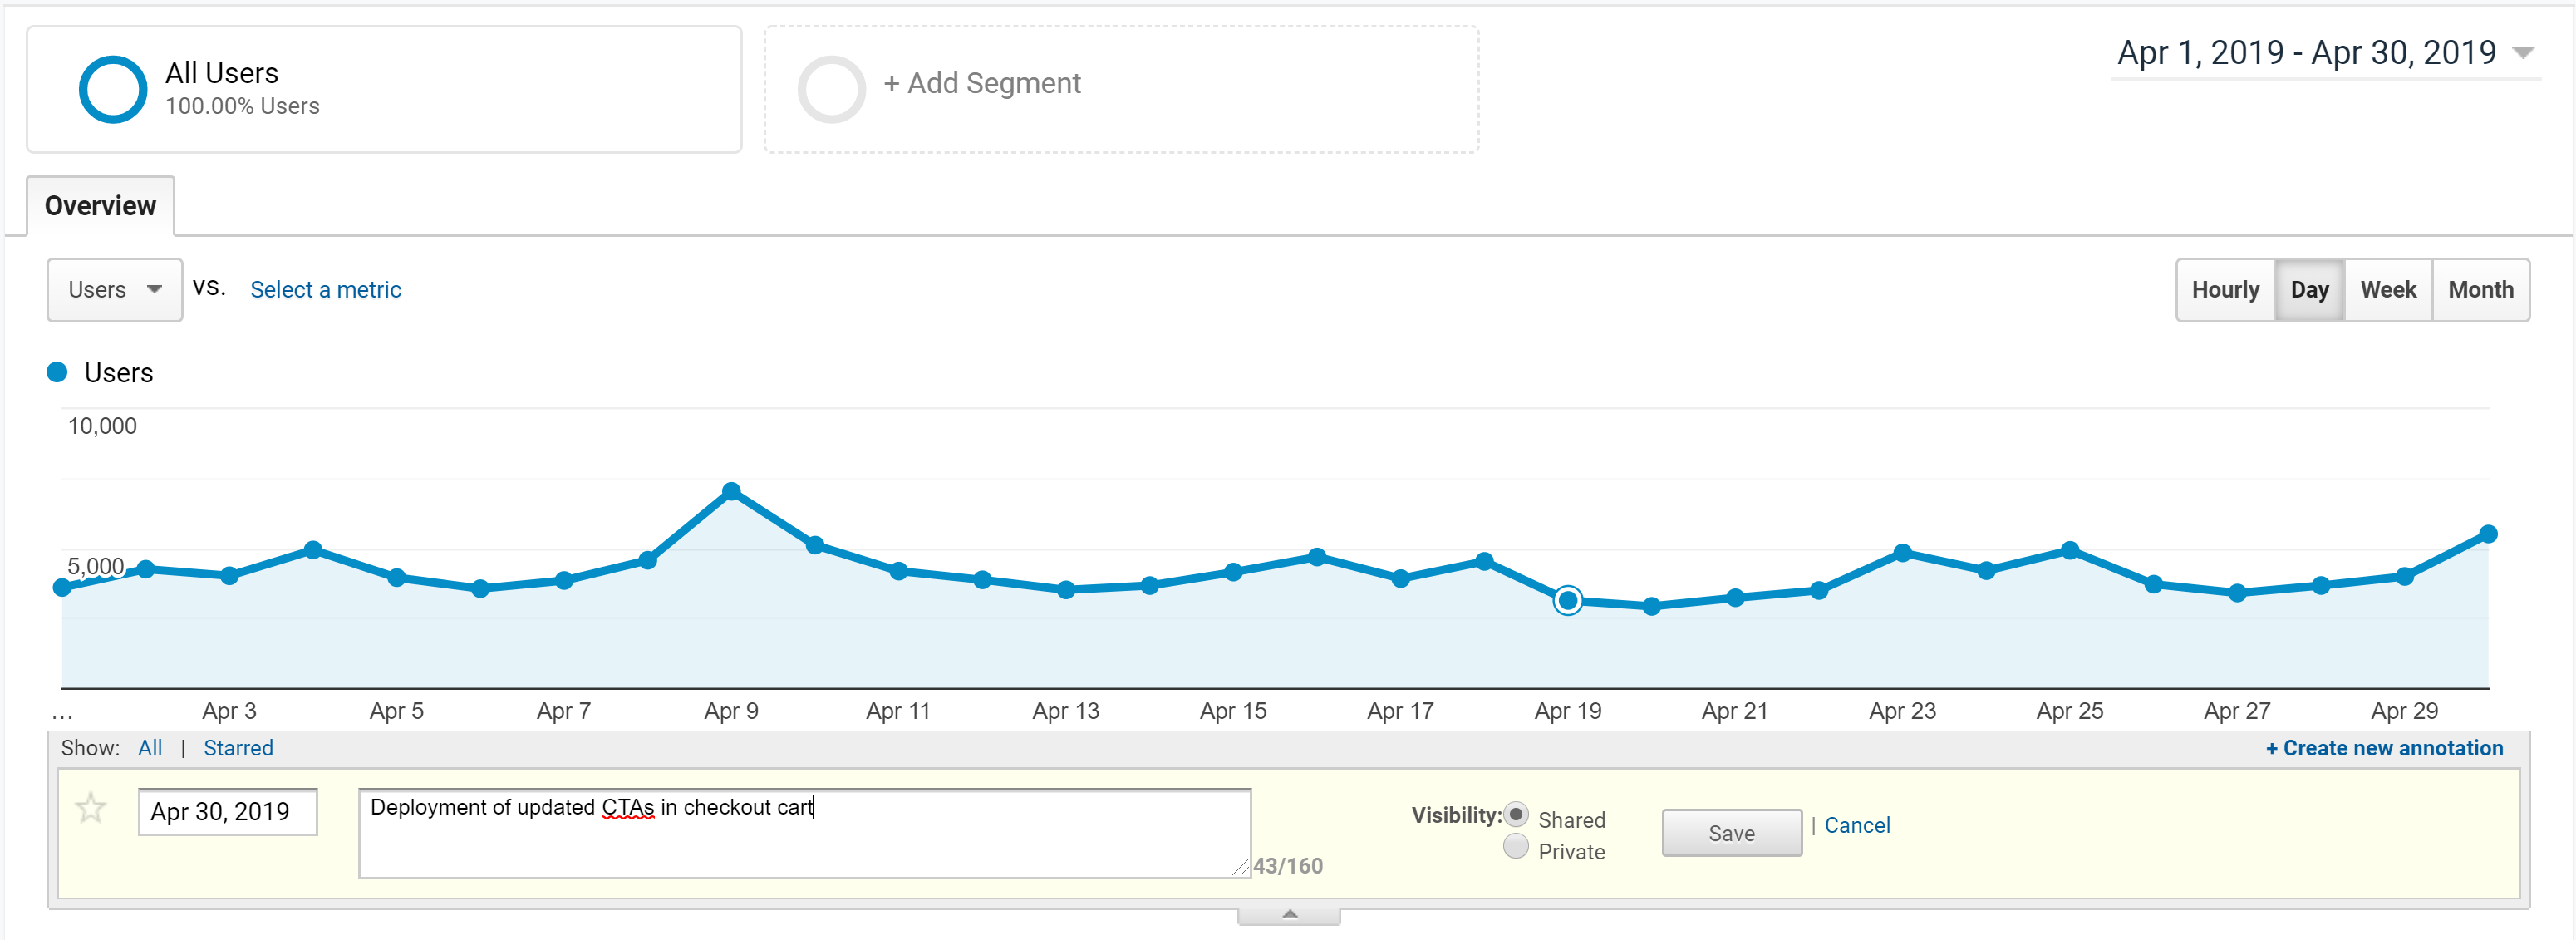
How to set-up Google Analytics Annotations
Setting-up Google Analytics Annotations couldn’t be simpler and only takes a few moments, simply follow these steps:
- Click the tab below timeline
- Click ‘create new annotation’
- Select date of annotation and add comments
Google Analytics Custom Alerts
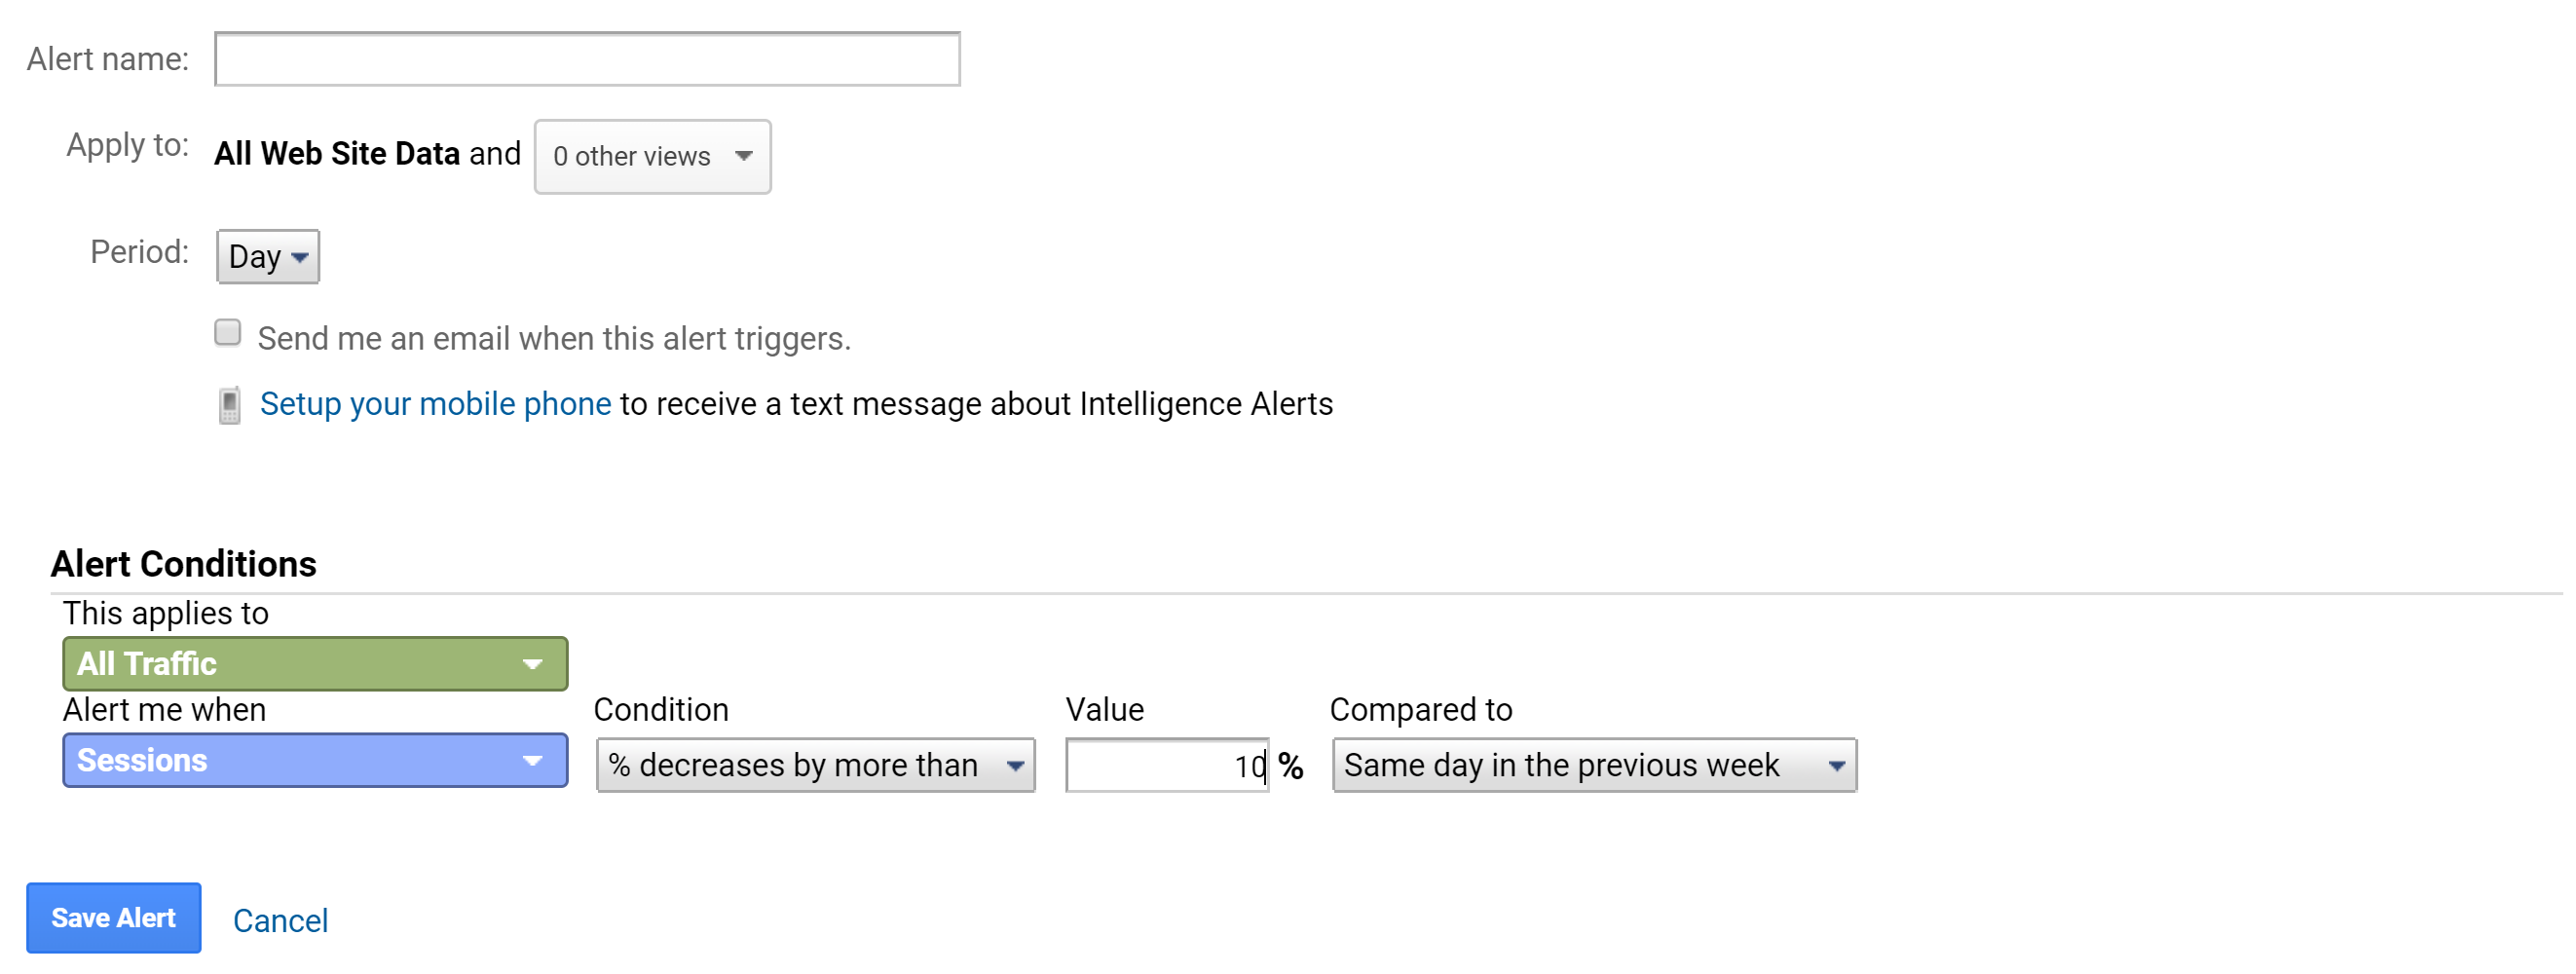
Google Analytics Custom Alerts provides an effective way to keep tabs on significant changes to important metrics and delivers the data straight into your inbox.
You can set-up alerts for all parameters and receive notifications when performance triggers a set value or percentage, such as an increase in page load speed or a decrease in bounce rate.
When selecting alerts, it’s a good idea to set opposing alerts to notify of increases and decreases to your chosen parameters.
How to set-up Google Custom Alerts
- Access admin control panel (via the gear icon)
- Click on Custom Alerts then click on New Alert
- Name and choose the parameters for your Alert
Using Google Analytics shortcuts help you to keep on-top of your data, but how do you make it more digestible?
What is Google Data Studio?
Google Data Studio is a data visualisation and analytics reporting tool that allows users to create customised live dashboards. Google Data Studio came out of beta at the end of 2018 and it’s quickly rewritten the rules of reporting. Often compared to Analytics ‘on steroids’ Google Data Studio boasts a list of key benefits, notably:
- Real Time
- Interactive
- Transparent
- Sharable
- Free
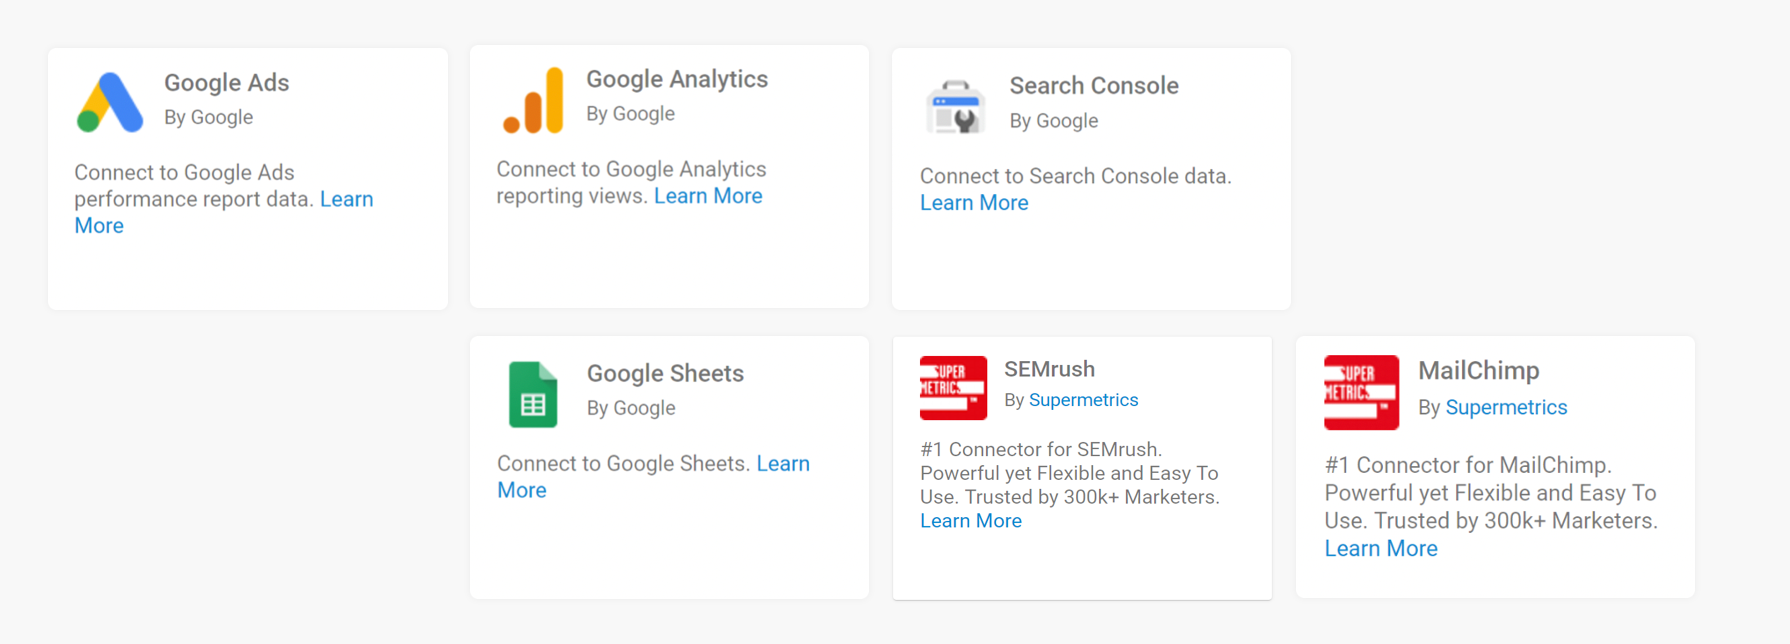
There are no limits to the number of widgets per page and you can access data from over 500 data sets via over 160 Connectors. Google offers several key Connectors including Google Ads, Google Analytics, Google Search Console and Google Sheets which are free to use.
A growing number of paid Partner Connectors allow you to import data from a diversity of data sets such as: Adobe Analytics, Bing Ads, SEMrush and MailChimp; providing a single point of reference and a single source of truth for all your analytics.
Google Data Studio is completely customisable, so it can look like anything you want, but here’s a mock-up Ridgeway dashboard with dummy data from a fictitious Google merchandise store (notice they haven’t filtered out location traffic from the Googleplex in Mountain View!)
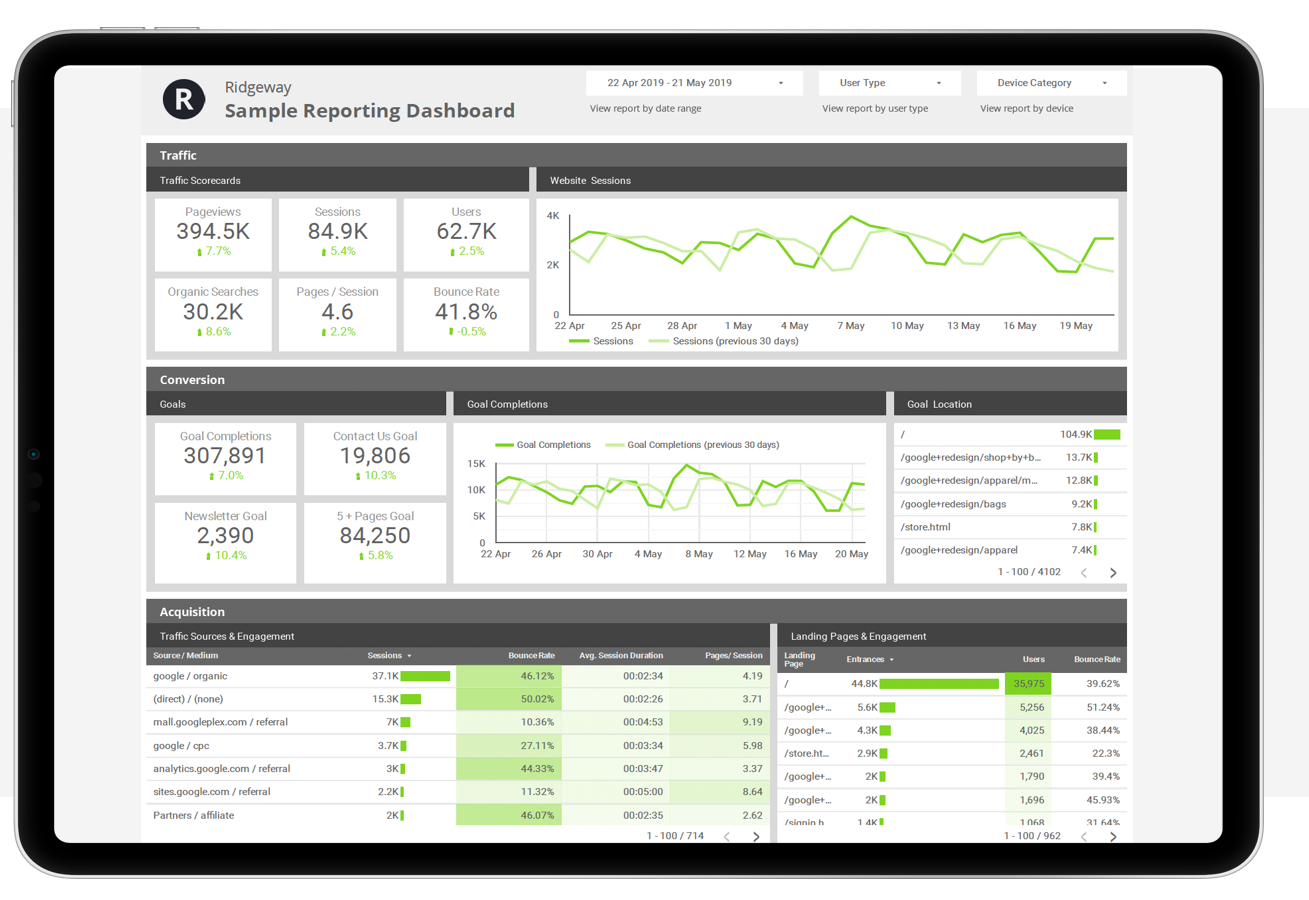
To quickly check Key Performance Indicators and Goals we have set-up colour coded scorecards which compare metrics in the current reporting period with the previous reporting period (green indicating a positive change and red indicating a negative change) so keep on-top of your analytics without breaking a sweat.
Daily Analytics Check 2 minutes to check that it’s Business as Usual via colour-coded scorecards
Weekly Analytics Check 30 minutes for a deeper-dive into the metrics and to assess KPIs
Monthly Analytics Check 60 minutes to identify Blockages and Opportunities that will inform SEO strategy for the coming month
Quarterly Analytics Check 120 minutes to strategically assess quarterly performance and measure how KPIs and Goals are progressing towards the North Star.
Google’s working hard to encourage the uptake of Data Studio and are continually releasing new features while newcomers can get a shortcut to reusable templates via Google’s Data Studio Report Gallery.